blog

Brand Awareness, Brand Salience, and Brand Favorability: Why Great Brands Need All Three

In boardrooms and marketing meetings, one question is asked more than any other:

“How strong is our brand in the minds of consumers?” The answer is rarely as simple as looking at social media followers, website traffic, or advertising reach. A truly strong brand isn’t just one that people knowโ€”it’s one they remember at the right moment, feel positively about, and ultimately choose.

This is where three important branding concepts come together: Brand Awareness, Brand Salience, and Brand Favorability.

Although these terms are often used interchangeably, they measure very different aspects of a brand’s relationship with its audience.

Understanding the difference can transform how organizations build, measure, and strengthen their brands.

Brand Awareness: “Do People Know You Exist?”

Brand Awareness is the foundation of every successful brand. It measures whether people recognize or recall your brand.

Ask someone: “Have you heard of this brand?” If the answer is yes, you have awareness.

Awareness answers questions like:

  • Do people recognize our logo?
  • Have they heard our company name?
  • Can they identify our products?
  • Do they know what category we belong to?

Advertising, public relations, sponsorships, social media, and word-of-mouth all contribute to increasing awareness. However, awareness alone does not guarantee business success. Millions of people know hundreds of brands they never purchase. Knowing a brand exists is only the beginning.

Brand Salience: “Do People Think of You When It Matters?”

Brand Salience goes a step further. Rather than asking whether people know your brand, it asks:

“Does your brand come to mind when customers actually need your product or service?”

Imagine you’re planning a holiday. 

You decide you need a hotel. Which hotel brand appears in your mind first? That is salience.

Or imagine you’re craving pizza.

The first restaurant you think about demonstrates the strongest salience.

A customer may be aware of twenty brands. Only two or three are mentally available during the purchase decision. Those brands usually win.

Marketing scientist Byron Sharp describes this as mental availability; the ease with which a brand comes to mind in buying situations. Salience is often a stronger predictor of future market share than awareness alone.

Brand Favorability: “How Do People Feel About You?”

Now imagine people know your brand. They think about your brand. But they don’t actually like it. This is where Brand Favorability becomes critical.

Brand Favorability measures the overall positive or negative attitude people have towards a brand.

Brand Favorability measures the overall positive or negative attitude people have towards a brand. It is shaped by a combination of factors, including the level of trust consumers place in the brand, their perception of its quality and reliability, its authenticity and innovation, the experiences it delivers, and the emotional connection it creates over time. Unlike brand awareness, which is about being known, brand favorability is about being valued. It reflects how people feel about a brandโ€”and those feelings often determine whether they choose it, recommend it, and remain loyal to it. 

At its core, brand favorability answers a simple but powerful question: “Do people have confidence in our brand?” When the answer is yes, the benefits extend far beyond a single purchase. Brands with high favorability tend to retain customers for longer, inspire more recommendations through word-of-mouth, command premium pricing, and build stronger long-term loyalty. Conversely, a brand can enjoy widespread recognition yet still struggle if public perception is negative. History is filled with companies that were famousโ€”but not respected. Being well known may get a brand noticed, but being well regarded is what earns lasting customer preference. 

The Three Work Together – From Recognition to Choice

Although these three concepts are distinct, they work together to influence every purchase decision. A simple everyday example illustrates how. 

Imagine you’re meeting a group of friends for dinner. Someone asks, “Where should we eat tonight?”

Several restaurant names are mentioned. The fact that those names even make it into the conversation is brand awareness, people know these restaurants exist.

As the discussion continues, one restaurant quickly stands out. It’s the first place that most people think of when deciding where to eat. That’s brand salienceโ€”the brand has earned a place in people’s minds at the very moment a decision is being made.

Then someone says, “Let’s go there. The food is always good, the service is excellent, and we’ve never had a bad experience.” Everyone agrees.

That’s brand favorability. Positive perceptions, trust, and past experiences turn a familiar, top-of-mind brand into the chosen one.

Now imagine the story continues.

After dinner, one of your friends stops at a supermarket to buy coffee for the next morning. As they walk through the aisle, they recognise dozens of coffee brands on the shelvesโ€”that’s brand awareness. Yet, when it’s time to make a purchase, only two or three brands immediately come to mind. That’s brand salience. Finally, they reach for one particular pack because they trust its quality, enjoy its taste, and believe it’s worth paying for. That’s brand favorability.

Whether choosing a restaurant, a cup of coffee, a smartphone, or even a financial service, consumers rarely make decisions by considering every available option. They first choose from the brands they know, then from the brands they remember at the right moment, and ultimately from the brands they feel most positive about.

The brands that consistently win are not simply the ones people recognise; they are the ones that become mentally available when it matters and emotionally preferred when the final choice is made.

A Practical Example

Imagine three grocery delivery brands operating in the same market. While all three compete for the same customers, they differ significantly in terms of awareness, salience, and favorability.

BrandAwarenessSalienceFavorabilityInterpretation
Brand AHighHighHighA market leader that is well known, top-of-mind, and well regarded by customers.
Brand BHighLowModeratePeople know the brand, but it is not their first choice when making a purchase, and perceptions are mixed.
Brand CModerateVery HighExcellentFewer people know the brand, but those who do immediately think of it when the need arises and hold it in very high regard.

Although Brand A is currently the market leader, Brand C may have the strongest long-term growth potential. By increasing its brand awareness while maintaining its high salience and strong favorability, it can significantly expand its customer base without losing the qualities that make it distinctive. The challenge for marketers is not understanding these concepts, but measuring them continuously as consumer perceptions evolve. That challenge has given rise to a new generation of AI-powered brand intelligence.  

Why Traditional Brand Tracking Isn’t Enough

For decades, organisations have relied on periodic surveys to understand how consumers perceive their brands. While surveys continue to provide valuable insights, they capture opinions at a single point in time and often reflect only a small sample of the market. In today’s digital world, however, consumers express their thoughts, opinions, and experiences continuously through social media, news platforms, online reviews, discussion forums, blogs, videos, and countless other digital channels. These ongoing conversations reveal how brand awareness, salience, and favorability evolve in real time. The challenge lies not in the availability of information, but in its sheer scale. Analysing millions of conversations across multiple platforms is beyond the capacity of any human team. This is where Artificial Intelligence is transforming brand intelligence, enabling organisations to continuously listen, interpret, and understand the ever-changing perceptions that shape their brands.

Measuring Brands in the Age of AI

Modern AI platforms leverage Natural Language Processing, Machine Learning, Behavioural Analytics, Sentiment Analysis, Geographic Intelligence, and Trend Detection to transform millions of public conversations into actionable intelligence, helping organisations understand not just what people are saying, but why brands occupy a particular place in consumers’ minds. 

Rather than relying on periodic surveys of a few hundred respondents, organisations can continuously track changes in brand perception, sentiment, and emerging narratives across markets, demographics, and regions.

The result is a richer, more dynamic understanding of brand health, enabling faster, better-informed strategic decisions.

Moving Beyond Brand Metrics

The next generation of brand intelligence isn’t simply measuring awareness or sentiment.

It seeks to understand the complete relationship between people and brands.

Questions such as:

  • Are people noticing us?
  • Are they remembering us?
  • Do they trust us?
  • How emotionally connected are they?
  • What narratives are shaping public perception?
  • Which cultural trends influence our brand?
  • How does perception vary across regions?
  • What concerns are emerging before they become crises?

Answering these questions requires a combination of AI, behavioural science, semiotics, and advanced analytics.

The Future of Deep Branding Intelligence

As brands become increasingly shaped by digital conversations and cultural narratives, traditional brand tracking methods alone are no longer sufficient.

Organizations need continuous intelligence, not occasional reports.

This shift from periodic measurement to continuous intelligence is driving a new generation of AI-powered brand analytics. Platforms such as TAGA, developed by Semiotica.ai, help organisations move beyond traditional brand tracking by continuously analysing public conversations, cultural signals, and behavioural patterns. By combining Artificial Intelligence with behavioural science, Natural Language Processing, semiotics, sentiment analytics, and geographic intelligence, TAGA enables leaders to monitor brand awareness, salience, favorability, trust, authenticity, emotional connection, emerging narratives, and cultural shifts through a unified intelligence platform. 

In the age of AI, the brands that win will not simply be those that speak the loudestโ€”they will be those that listen continuously, understand deeply, and respond intelligently. 

Awareness, Salience, and Favorability are only three dimensions of brand health. Truly understanding a brand requires deeper insight into trust, authenticity, emotional connection, cultural relevance, distinctiveness, advocacy, and the narratives that shape public perception. As AI continues to reshape how organisations understand markets, mastering these deeper dimensions of brand intelligence will become a competitive advantage rather than a marketing luxury. 

About the Author

Jacob M. George is an entrepreneur, AI strategist, and branding researcher with more than 25 years of experience building technology companies and digital platforms. As the Co-Founder  of Semiotica.ai, he is pioneering the field of Deep Branding and Cultural Intelligence, applying Artificial Intelligence, behavioural science, and semiotics to help organisations understand how public perception shapes brands, policies, and societal change. He regularly writes on AI, branding, public policy intelligence, and emerging technologies.


About Semiotica.ai

Semiotica.ai is an Artificial Intelligence company building advanced intelligence platforms for governments, enterprises, and institutions. Its flagship platforms include TAGA, an AI-powered Deep Branding and Cultural Intelligence platform, and Policy Pulse, an AI-powered Public Policy Intelligence platform. By integrating AI, behavioural science, semiotics, and predictive analytics, Semiotica.ai transforms large-scale public data into actionable intelligence that helps leaders make better strategic decisions.

semiotica_Data-Collection

Introducing the Unified Data Collection Framework Powering Semiotica.ai and TAGA

Artificial Intelligence is only as effective as the quality of the data behind it. While sophisticated AI models often receive the spotlight, the real differentiator lies in how efficiently, consistently, and accurately data is collected.

Today, we’re proud to introduce the Unified Data Collection Framework, a significant new capability within the Semiotica technology ecosystem.

This framework now serves as the data foundation for two of our flagship AI platforms:

Semiotica.ai

An AI-powered Public Policy Intelligence platform that helps governments, policymakers, institutions, and organisations understand public sentiment, evaluate policy impact, monitor behavioural trends, and make data-driven decisions.

TAGA

Our AI-powered Deep Branding and Cultural Intelligence platform, designed to help brands understand emotions, narratives, cultural signals, reputation, and evolving consumer behaviour at a much deeper level.

Although these platforms address different challenges, they share a common requirementโ€”high-quality, structured, and reliable data.

That is precisely why we built this new capability.

What the New Framework Delivers

Our Unified Data Collection Framework introduces a standardized approach to acquiring data from multiple digital sources while ensuring consistency across every downstream AI workflow.

Unified Data Structure

Information collected from different sources is automatically transformed into a common format, enabling faster AI processing and improved analytical consistency.

Simplified Source Configuration

Analysts can configure and manage multiple data sources through a single, intuitive interface, reducing operational complexity.

Standardized Collection Process

Every collection follows a consistent workflow, ensuring repeatability, governance, and scalability across projects.

Reliable Data Backup

Collected datasets are securely preserved, providing complete traceability and supporting future validation, audits, and model training.

Higher Data Quality

By reducing manual intervention and standardizing collection procedures, the framework significantly minimizes operational errors.

Faster Collection

Compared with previous manual workflows, the new framework delivers up to three times faster data collection, allowing intelligence teams to respond more quickly to emerging events and trends.

Building the Foundation for AI Intelligence

Whether analysing citizen sentiment around public policy through Semiotica.ai, or uncovering cultural narratives and brand perception through TAGA, every insight begins with trusted data.

This new capability strengthens the core infrastructure supporting our AI ecosystem and enables faster innovation across our products.

As we continue expanding into predictive intelligence, behavioural analytics, narrative analysis, and next-generation AI applications, investments in robust data engineering remain central to our mission.

Because exceptional AI is not built on algorithms aloneโ€”it is built on exceptional data.

blog

Why Civilizations Decline When Merit Gives Way to Coercion

Throughout history, some of the worldโ€™s most powerful empires, political systems, religious institutions, and organizations appeared invincible during their peak. Many controlled vast territories, commanded immense military strength, shaped global culture, and exercised enormous influence over human civilization.

Yet history repeatedly demonstrates a striking pattern: systems built primarily on coercion may rise rapidly, but systems capable of rewarding merit, adapting to change, and sustaining legitimacy endure far longer.

The long-term survival of civilizations has rarely depended solely on military power or centralized authority. It has depended on whether institutions remained capable of innovation, competence, inclusion, self-correction, and intellectual openness.

The Structural Difference Between Coercion and Merit

A system built on coercion depends heavily on fear, suppression, centralized control, and obedience. Such systems often prioritize loyalty over competence and discourage criticism in the name of unity or stability.

A merit-based system, in contrast, depends on capability, institutional trust, fair competition, adaptability, and the ability to reward excellence regardless of hierarchy or political proximity.

Coercive systems often generate rapid short-term consolidation because fear is an efficient mechanism for control. However, history frequently shows that these systems struggle to sustain innovation, institutional resilience, and voluntary legitimacy over long periods.

Merit-based systems survive longer because they remain capable of internal renewal.

Historical Patterns Across Civilizations

The Roman Empire survived for centuries not merely because of military conquest, but because of its administrative flexibility, legal systems, infrastructure, and ability to integrate talent across regions. However, internal decline accelerated when political loyalty increasingly overtook competence, corruption became systemic, and institutional trust weakened.

The Ottoman Empire similarly thrived during periods when administrative and military systems rewarded strategic capability and competence. But over time, institutional rigidity, political favoritism, and resistance to modernization weakened its ability to compete with rapidly evolving European powers.

The Mughal Empire under Akbar demonstrated the stabilizing power of inclusive governance, administrative merit, and religious pluralism. Yet later phases increasingly relied on centralized coercion, religious rigidity, and court politics over institutional adaptability.

The Soviet Union offers one of the clearest modern examples of the limitations of coercive systems. Despite enormous military and industrial capabilities, prolonged suppression of dissent, bureaucratic rigidity, and restrictions on intellectual openness weakened the systemโ€™s ability to self-correct and innovate.

Across very different civilizations and eras, the underlying pattern remains remarkably consistent.

The Institutional Cost of Suppressing Merit

When institutions begin rewarding obedience more than capability, decline often begins internally long before collapse becomes externally visible.

This pattern extends far beyond empires and governments.

Modern organizations, political parties, corporations, universities, and even technological ecosystems face similar risks when:

  • internal criticism is punished,
  • leadership selection deteriorates,
  • innovation slows,
  • mediocrity is rewarded for loyalty,
  • and institutional adaptability weakens.

In many cases, decline does not begin because competitors become stronger. Decline begins because institutions lose the ability to identify and correct their own failures.

Why Merit-Based Systems Endure Longer

Merit-based systems are not perfect, nor are they free from inequality or conflict. However, they possess several structural advantages that repeatedly improve long-term survival:

  • faster correction of errors,
  • stronger innovation capacity,
  • greater institutional resilience,
  • higher adaptability during crises,
  • and stronger voluntary legitimacy.

Coercive systems consume enormous energy maintaining fear and centralized control. Merit-based systems redirect that energy toward growth, renewal, and problem-solving.

History often shows that societies capable of encouraging inquiry, rewarding competence, tolerating criticism, and adapting to changing realities are significantly more resilient than systems dependent primarily on suppression and rigid authority.

The Core Lesson of History

The greatest misconception in history is believing that power alone guarantees permanence. It does not.

History is filled with fallen emperors, collapsed ideologies, fragmented empires, and discredited regimes that once appeared invincible.

Fear may silence opposition temporarily. Propaganda may shape perception temporarily. Violence may establish dominance temporarily. But no civilization, institution, political movement, or organization can sustain legitimacy indefinitely through coercion alone.

History often shows that what ultimately survives is not merely power, but legitimacy reinforced by competence.

Civilizations begin to decline the moment they reward loyalty more than capability, obedience more than excellence, and conformity more than truth.

The deeper lesson of history is clear: coercion may achieve rapid dominance, but merit builds lasting continuity.

In the end, the true strength of a civilization is not measured by its ability to control people, but by its ability to continually deserve their trust.


Jacob M George is an entrepreneur, AI strategist, and technology leader with over two decades of experience building digital platforms across marketing technology, artificial intelligence, branding intelligence, and public opinion analytics.

As Co-founder and Director of Semiotica.ai, Jacob has been closely involved in the strategic planning, development, and market introduction of the company’s AI-powered intelligence platforms. Working alongside his fellow co-founders and leadership team, he has contributed to the evolution of Semiotica’s Public Opinion Intelligence Platform, which has been used to analyze voter sentiment, public perception, and electoral trends, including election prediction initiatives in India.

He has also been actively involved in shaping Semiotica’s Deep Branding Intelligence Platform, helping organizations understand and measure brand perception through AI-driven sentiment analysis, positioning intelligence, reputation monitoring, and audience insights. His work focuses on connecting data, human behavior, public sentiment, and strategic decision-making to create actionable intelligence for organizations.

In addition to his role at Semiotica.ai, Jacob is the Founder & CEO of cmercury, a next-generation email marketing and customer engagement platform recognized for its innovations in deliverability, engagement intelligence, AI-driven optimization, and flexible performance-based pricing. Under his leadership, cmercury has grown into a globally recognized platform serving businesses across diverse industries.

Jacob is a frequent speaker on artificial intelligence, public sentiment analysis, branding intelligence, digital communications, and email marketing. Through his work across both Semiotica.ai and cmercury, he continues to explore how AI and data-driven technologies can help organizations better understand people, strengthen brands, improve communication, and make informed decisions.

Kerala Election 2026 voter turnout

Kerala Election 2026: Voter Turnout Surge Signals a New Political Pulse

Namaskaaram Kerala!

If thereโ€™s one takeaway from the Kerala Election 2026 voter data, itโ€™s this, people showed up, and they showed up in big numbers.

According to the post-poll analysis powered by Semiotica AI, Kerala recorded an impressive 79.63% voter turnout in 2026. Thatโ€™s not just a number. Thatโ€™s a statement.

The ballots were in.
The mood shifted.
And the political battlefield heated up. This wasnโ€™t just another election, this was Kerala sending a message.

District-Level Trends: Enthusiasm Was Uneven but Powerful

The numbers revealed fascinating patterns across districts.

Kozhikode led the state with a massive 81.25% turnout, showcasing strong political engagement. On the other end, Pathanamthitta recorded 70.70%, the lowest turnout across districts.

This gap told an important story, enthusiasm varied, and where enthusiasm rises, political outcomes often shift. These turnout differences could reshape the 2026 political battleground significantly.

Constituency-Level Drama: From Record Highs to Quiet Zones

The constituency-wise data added even more drama.

Nilambur topped the chart with a stunning 89.19% turnout, indicating intense voter mobilisation. Meanwhile, Ranni recorded 68.99%, showing relatively lower engagement.

From overwhelming enthusiasm to cautious turnout, Kerala presented a spectrum of voter sentiment.

And in elections, sentiment matters.

Northern Kerala: Mixed Signals but Rising Momentum

Kasaragod: A Steady Rise

Kasaragod delivered encouraging signals.

  • Kasaragod constituency surged 8.03%
  • Manjeshwaram rose 2.87%
  • Kanhangad climbed 1.03%

Overall, Kasaragod recorded a 2.71% increase, pointing to rising voter enthusiasm.

Kannur: A Surprise Drop

In contrast, Kannur sent caution signals.

  • Irikkur dropped 3.62%
  • Taliparamba declined 2.17%
  • Kalliasseri fell 1.45%

Overall, Kannur recorded a 1.26% drop, showing voter fatigue in some pockets.

Hill Districts and Coastal Shifts

Wayanad: Strong Participation

Wayanad saw increased participation

  • Sulthan Bathery surged 3.02%
  • Mananthavady rose 2.23%

Overall turnout increased 2.27%.

Kozhikode: Mixed But Rising

Urban areas saw significant jumps

  • Kozhikode South rose 5.61%
  • Kozhikode North climbed 4.31%
  • Beypore rose 4.40%

Overall district turnout rose 0.91%.

Malappuram: Massive Voter Mobilisation

Malappuram emerged as a major hotspot

  • Vengara surged 8.53%
  • Malappuram climbed 7.11%
  • Manjeri rose 6.70%

Overall turnout surged 4.07%, one of the highest increases statewide.

This indicated strong voter mobilisation and political interest.

Central Kerala: Strong Urban Engagement

Palakkad

Palakkad saw notable growth

  • Malampuzha jumped 5.09%
  • Kongad climbed 3.55%
  • Palakkad surged 6.32%

Overall district turnout rose 2.50%.

Thrissur

Thrissur recorded mixed signals

  • Thrissur rose 4.99%
  • Ollur climbed 4.54%
  • Kunnamkulam dropped 1.42%

Overall turnout rose 1.52%.

Urban Wave: Ernakulam Leads the Charge

Ernakulam recorded one of the strongest urban surges

  • Kochi jumped 9.41%
  • Ernakulam surged 10.88%
  • Thrikkakara climbed 8.03%

Overall turnout rose 3.99%.

Urban voters clearly stepped forward.

High Participation in Southern Kerala

Idukki

Idukki recorded major growth

  • Devikulam surged 9.52%
  • Idukki rose 4.97%

Overall turnout increased 5.46%.

Kottayam

Kottayam saw marginal rise

  • Vaikom rose 1.89%
  • Puthuppally dropped 2.14%

Overall turnout rose 0.47%.

Coastal Movement: Alappuzha and Kollam

Alappuzha recorded mixed trends

  • Ambalappuzha rose 4.27%
  • Kuttanad dropped 2.62%

Overall turnout rose 0.57%.

Kollam saw moderate growth

  • Eravipuram surged 5.07%
  • Kollam rose 3.54%

Overall turnout rose 1.32%.

Capital Surge: Thiruvananthapuram Leads

Thiruvananthapuram recorded massive voter mobilisation

  • Thiruvananthapuram jumped 11.68%
  • Nemom rose 9.29%
  • Vattiyoorkavu surged 10.91%

Overall turnout rose 5.21%, among the highest increases.

The capital district sent strong electoral signals.

What This Means for Democracy

Increased voter participation is more than just numbers, it reflects:

  • Higher political awareness
  • Stronger citizen engagement
  • Better representation
  • Greater accountability

When more people vote, democracy becomes stronger.

Local issues gain attention.
Policies become more people-centric.
Governance becomes more responsive.

The Bigger Picture: Keralaโ€™s Democratic Strength

Kerala Election 2026 turnout trends showed one powerful reality, people cared deeply about their future.

The rise in participation across districts indicated growing democratic engagement.

And when citizens participate actively, elections become more representative and inclusive.

Final Word: Every Vote Shapes Kerala

The 2026 voter turnout surge highlighted something remarkable, Keralaโ€™s democracy is alive and evolving.

More voters meant stronger voices.
Stronger voices meant better governance.

And ultimatelyโ€ฆ
More participation meant a stronger Kerala.

Because in the end,
Every vote matters. Every voice counts. And every citizen shapes the future. ๐Ÿ‡ฎ๐Ÿ‡ณ

The Role of AI in Shaping Elections

Hereโ€™s where things get even more interesting.

Artificial Intelligence is changing election analysis.

Semitoca AI can:

  • Track voter sentiment
  • Predict turnout trends
  • Analyse constituency patterns
  • Identify swing regions

This means political campaigns can now respond faster, target smarter, and strategies better.

Artificial intelligence is not just analysing elections; it is shaping them.

To know more visit semiotica.ai

Alathur constituency 2026 voter sentiment

Alathur Constituency 2026 Voter Sentiment: LDF Stronghold & Election Analysis

Alathur constituency 2026 voter sentiment highlights a strong and stable electoral pattern as Kerala approaches the Legislative Assembly Elections 2026. The constituency is emerging as a clear stronghold of the Left Democratic Front (LDF), driven by robust governance perception and consistent voter support.

According to AI-driven insights from Semiotica.ai, the Alathur constituency 2026 voter sentiment shows strong alignment between perception metrics and projected vote share, firmly positioning the LDF ahead of its competitors. The United Democratic Front (UDF) remains the primary challenger but trails significantly, while the NDA has limited influence.

Alathur Constituency 2026 Voter Sentiment Overview

The Alathur constituency 2026 voter sentiment reflects a stable electoral environment where one alliance maintains a clear and consistent advantage.

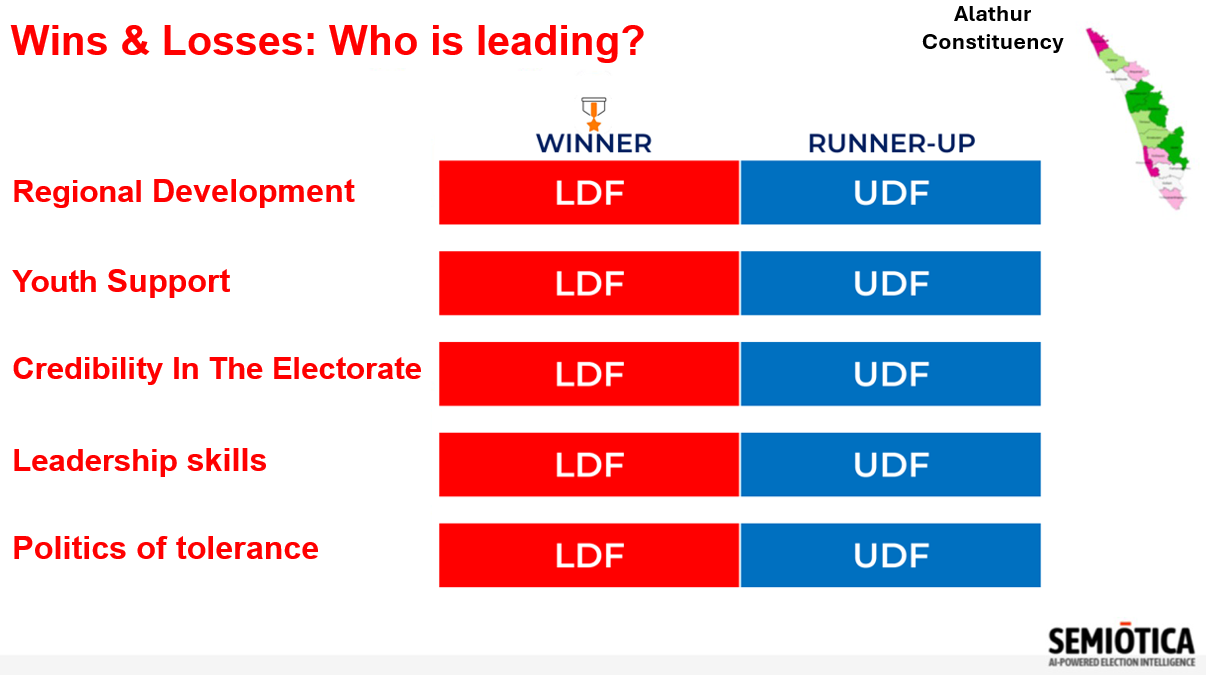
The LDF leads across all major voter perception dimensions, reinforcing its position as a governance-focused and trusted political force in the constituency.

Alliance Positioning and Voter Perception

A detailed look at perception metrics strengthens the Alathur constituency 2026 voter sentiment:

The LDF dominates across all five key metrics, while the UDF trails significantly in each category. The NDA maintains only a limited presence.

Vote Share Trends in Alathur

The Alathur constituency 2026 voter sentiment is clearly supported by projected vote share data:

  • LDF: 50.89%
  • UDF: 35.61%
  • NDA: 13.50%

The LDF leads by more than 15 percentage points, indicating a strong and consolidated voter base. The UDF remains the main challenger but lacks sufficient momentum to close the gap.

Why LDF Holds a Strong Advantage in Alathur

Several factors explain the strong Alathur constituency 2026 voter sentiment in favour of the LDF:

  • Strong governance perception among voters
  • High leadership credibility and trust
  • Effective engagement with youth and communities
  • Consistent performance across all key metrics

These factors combine to create a stable and well-rounded electoral advantage.

Stability and Low Electoral Volatility

One of the defining characteristics of Alathur constituency 2026 voter sentiment is its stability:

  • LDF leads in perception
  • LDF leads in vote share
  • UDF remains a distant challenger
  • NDA has limited influence

This makes Alathur a low-volatility constituency where major electoral shifts are unlikely.

Conclusion

In conclusion, the Alathur constituency 2026 voter sentiment firmly establishes the LDF as the dominant political force in the constituency.

With strong perception metrics, a clear vote share lead, and low electoral volatility, Alathur stands out as a secure LDF-leaning seat in the Kerala Assembly Elections 2026.

๐Ÿ‘‰ Follow Semiotica.ai for real-time election intelligence and AI-driven insights into Kerala 2026.

kaipamangalam voter sentiment analysis 2026

Kaipamangalam Voter Sentiment Analysis 2026: LDF Strengthens Lead with Consistent Governance Advantage

Kaipamangalam voter sentiment analysis 2026 indicates a clear and stable electoral trend as Kerala approaches the Legislative Assembly Elections. The constituency is emerging as a stronghold for the Left Democratic Front (LDF), with consistent dominance across perception metrics and projected vote share.

Semiotica.aiโ€™s latest data-driven insights highlight how governance performance and leadership perception are shaping voter preferences in Kaipamangalam.

Kaipamangalam: A Stable LDF-Leaning Constituency

Kaipamangalam reflects a structured electoral landscape where voter sentiment shows clear alignment toward LDF. The kaipamangalam voter sentiment analysis 2026 reveals limited volatility, with one alliance maintaining a steady lead across multiple voter dimensions.

This positions the constituency as relatively predictable compared to more competitive seats.

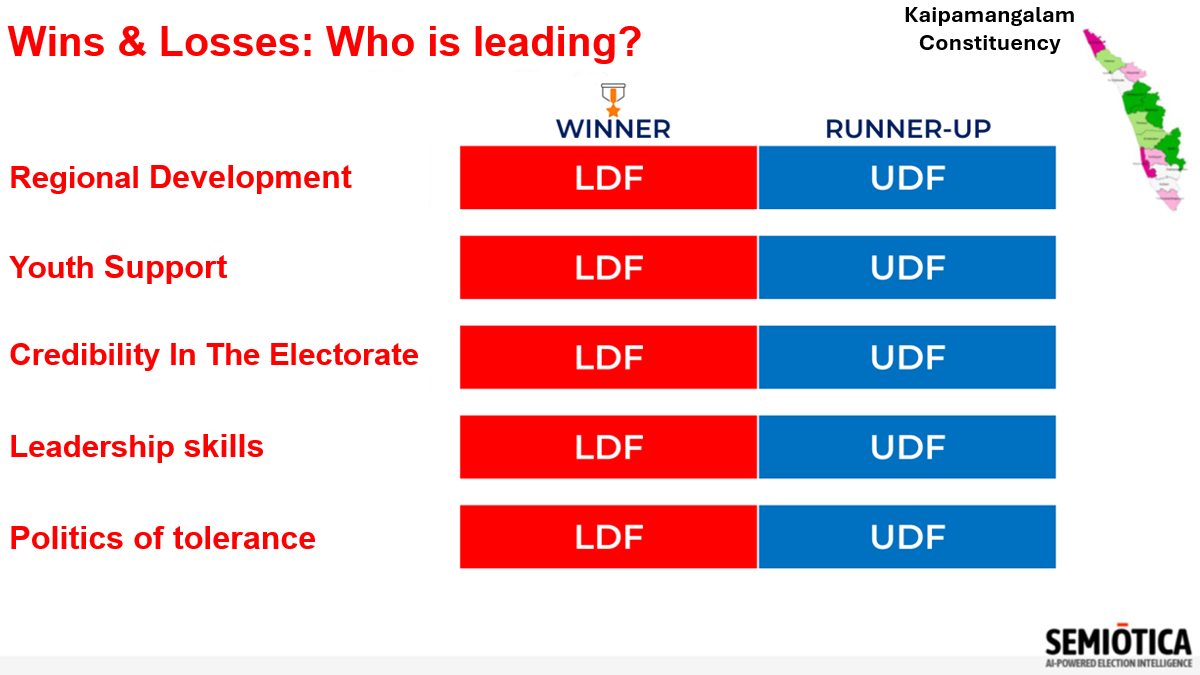
Alliance Positioning: LDF Leads Across All Metrics

Semioticaโ€™s analysis shows a consistent LDF advantage:

What This Means
  • LDF leads across all five key voter perception metrics
  • Strong consistency in governance, leadership, and youth appeal
  • UDF remains present but unable to challenge effectively
  • NDA has limited influence across all dimensions

๐Ÿ‘‰ Key Insight:
The kaipamangalam voter sentiment analysis 2026 highlights uniform voter preference toward LDF, indicating strong consolidation.

Vote Share Trends: LDF Holds Decisive Lead

As per projections (April 1, 2026):

  • LDF: 47.87%
  • UDF: 33.79%
  • NDA: 18.34%
Key Observations
  • LDF leads by over 14 percentage points
  • UDF remains the primary challenger but trails significantly
  • NDA holds a moderate vote share that may influence margins

๐Ÿ‘‰ Key Insight:
The vote share strongly validates the kaipamangalam voter sentiment analysis 2026, reinforcing LDFโ€™s stable electoral advantage.

What Will Decide Kaipamangalam 2026?

1๏ธโƒฃ Sustaining Governance Advantage

Can LDF maintain its strong perception across all metrics?

2๏ธโƒฃ Opposition Strategy

Can UDF improve its voter connect and reduce the gap?

3๏ธโƒฃ Margin Impact

Will NDAโ€™s vote share influence the final margin?

Conclusion: Clear LDF Stronghold

The kaipamangalam voter sentiment analysis 2026 clearly indicates:

  • LDF is the dominant political force
  • Strong alignment between perception and vote share
  • Low volatility makes the outcome highly predictable

Kaipamangalam stands out as a stable LDF stronghold heading into the 2026 elections.

๐Ÿ‘‰ Follow Semiotica.ai for real-time election intelligence and AI-driven insights into Kerala 2026.

perumbavoor voter sentiment analysis 2026

Perumbavoor Voter Sentiment Analysis 2026: UDF Leads with Balanced Competition from LDF

Perumbavoor voter sentiment analysis 2026 reveals a moderately competitive electoral landscape, where the United Democratic Front (UDF) holds a clear lead but faces consistent competition from the Left Democratic Front (LDF).

Perumbavoor: Advantage with Competitive Signals

Perumbavoor reflects a structured electoral pattern with defined leadership but measurable opposition strength. The perumbavoor voter sentiment analysis 2026 highlights a constituency that is stable but not fully consolidated.

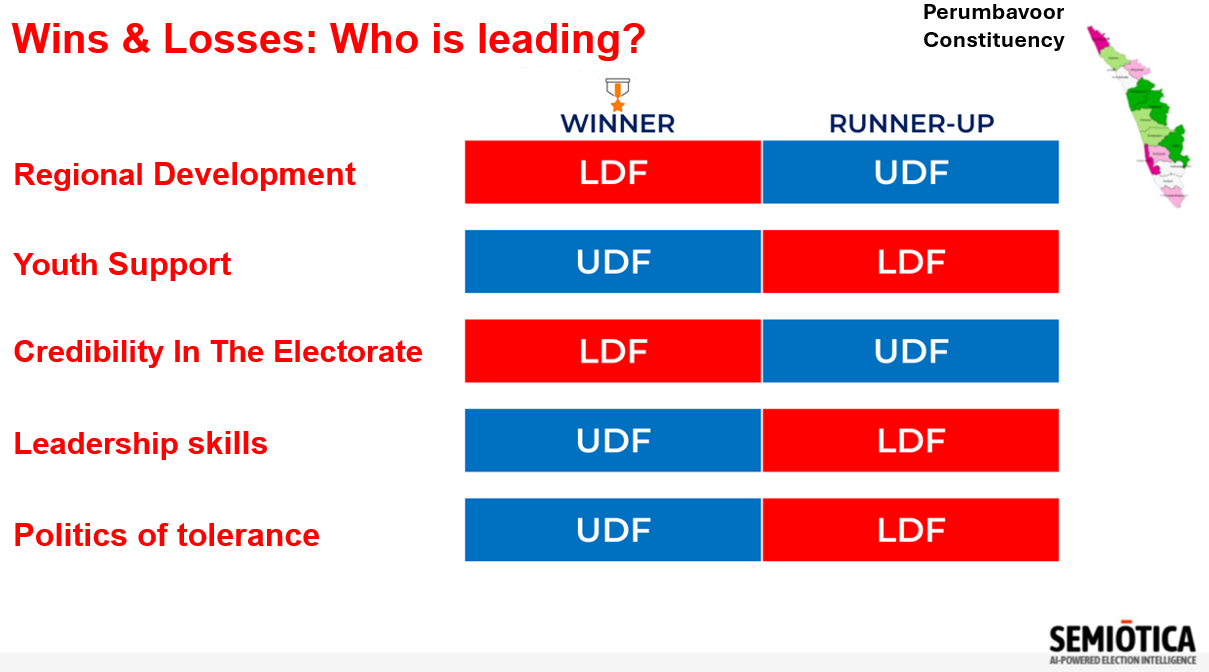
Alliance Positioning: UDF Leads in Key Metrics

What This Means
  • UDF leads in three out of five metrics
  • LDF remains strong in development and trust
  • NDA has moderate presence

๐Ÿ‘‰ Key Insight:
The perumbavoor voter sentiment analysis 2026 reflects UDF advantage with LDF competitiveness.

Vote Share Trends: UDF Holds Clear Lead

  • UDF: 47.33%
  • LDF: 35.74%
  • NDA: 16.93%
Key Observations
  • UDF leads by over 11 percentage points
  • LDF remains a strong challenger
  • NDA influences margins

๐Ÿ‘‰ Key Insight:
The constituency shows clear advantage but not complete dominance.

Conclusion: UDF Ahead with Moderate Competition

The perumbavoor voter sentiment analysis 2026 indicates:

  • UDF holds a strong lead
  • LDF remains competitive
  • NDA adds a third-force dimension

Perumbavoor stands as a UDF-leaning constituency with competitive signals.

๐Ÿ‘‰ Follow Semiotica.ai for real-time election intelligence and AI-driven insights into Kerala 2026.

kodungallur voter sentiment analysis 2026

Kodungallur Voter Sentiment Analysis 2026: LDF Leads with Strong Base but NDA Emerges Influential

Kodungallur voter sentiment analysis 2026 reveals a structured electoral landscape as Kerala approaches the Legislative Assembly Elections. The constituency is emerging as an LDF-leaning seat, with consistent strength across perception metrics and a clear vote share advantage.

However, unlike stable strongholds, Kodungallur also shows notable third-force dynamics, with NDA holding a significant vote share that could influence margins.

Kodungallur: Advantage with Competitive Undercurrents

Kodungallur reflects a semi-stable electoral pattern where one alliance leads clearly, but others retain measurable influence. The kodungallur voter sentiment analysis 2026 highlights a constituency that is stable, yet strategically important due to competitive signals.

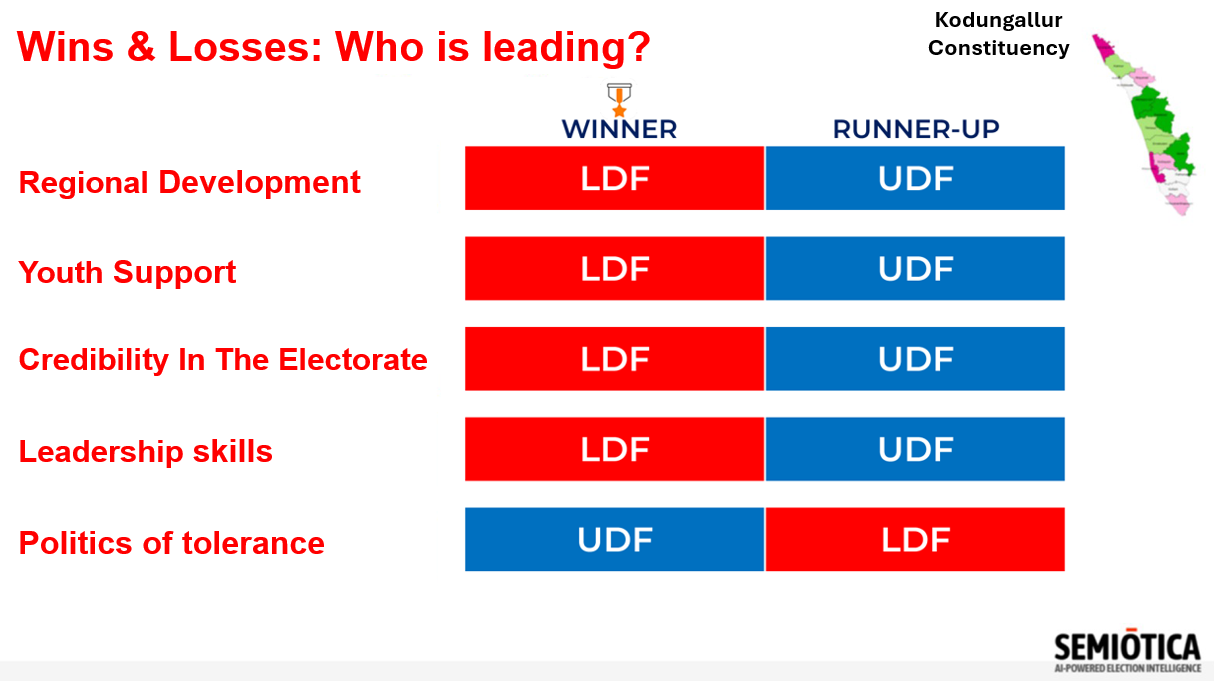
Alliance Positioning: LDF Leads Across Core Metrics

What This Means
  • LDF leads in four out of five key metrics
  • Strong governance perception across development and leadership
  • UDF shows strength only in inclusiveness
  • NDA maintains moderate perception across dimensions

๐Ÿ‘‰ Key Insight:
The kodungallur voter sentiment analysis 2026 reflects LDF dominance with visible competitive undercurrents.

Vote Share Trends: LDF Leads, NDA Holds Significant Share

As per projections (April 3, 2026):

  • LDF: 42.74%
  • UDF: 33.78%
  • NDA: 23.48%
Key Observations
  • LDF leads by nearly 9 percentage points
  • UDF remains the primary challenger
  • NDA holds a strong third-force presence

๐Ÿ‘‰ Key Insight:
While LDF leads comfortably, NDAโ€™s vote share adds complexity to the contest.

Conclusion: LDF Ahead, but Margins Influenced by NDA

The kodungallur voter sentiment analysis 2026 indicates:

  • LDF is the leading force
  • UDF remains competitive
  • NDA significantly impacts margin dynamics

Kodungallur stands as an LDF-leaning constituency with layered competition.

๐Ÿ‘‰ Follow Semiotica.ai for real-time election intelligence and AI-driven insights into Kerala 2026.

angamaly voter sentiment analysis 2026

Angamaly Voter Sentiment Analysis 2026: UDF Dominates with Strong Leadership and Vote Share Advantage

Angamaly voter sentiment analysis 2026 highlights a clear and decisive electoral trend, positioning the constituency as a stronghold for the United Democratic Front (UDF).

Semiotica.aiโ€™s analysis shows strong alignment between voter perception and vote share, indicating a high-confidence UDF advantage.

Angamaly: A Clear UDF Stronghold

Angamaly reflects a stable electoral landscape where one alliance dominates across all major voter dimensions. The angamaly voter sentiment analysis 2026 indicates low volatility and strong consolidation.

Alliance Positioning: UDF Leads Across All Metrics

What This Means
  • UDF leads in all five key metrics
  • Strong dominance in leadership and inclusiveness
  • LDF trails across all dimensions
  • NDA remains non-competitive

๐Ÿ‘‰ Key Insight:
The angamaly voter sentiment analysis 2026 reflects complete perception dominance by UDF.

Vote Share Trends: Decisive UDF Lead

  • UDF: 52.81%
  • LDF: 39.92%
  • NDA: 7.26%
Key Observations
  • UDF leads by nearly 13 percentage points
  • LDF remains secondary
  • NDA has minimal impact

๐Ÿ‘‰ Key Insight:
Vote share strongly validates perception dominance, confirming UDFโ€™s stronghold status.

Conclusion: Strong UDF Dominance

The angamaly voter sentiment analysis 2026 clearly shows:

  • UDF is the dominant force
  • Strong perception-vote alignment
  • Low electoral volatility

Angamaly stands as a clear UDF stronghold.

๐Ÿ‘‰ Follow Semiotica.ai for real-time election intelligence and AI-driven insights into Kerala 2026.

Chalakudy constituency 2026 voter sentiment

Chalakudy Constituency 2026 Voter Sentiment: UDF Lead & Election Analysis

Chalakudy constituency 2026 voter sentiment reveals a clear and structured electoral pattern as Kerala approaches the Assembly Elections 2026. The constituency is emerging as a strong seat for the United Democratic Front (UDF), with consistent advantages across both voter perception and vote share.

According to AI-driven insights by Semiotica.ai, the Chalakudy constituency 2026 voter sentiment highlights a strong alignment between alliance positioning and electoral performance. While the Left Democratic Front (LDF) remains a competitive challenger, it trails behind the UDF, and the NDA continues to have a limited role.

Chalakudy Constituency 2026 Voter Sentiment Overview

The Chalakudy constituency 2026 voter sentiment reflects a well-balanced and consistent advantage for the UDF. Across all major voter perception dimensions, the UDF maintains a lead, indicating strong voter connection and trust.

This alignment between perception and electoral outcomes positions Chalakudy as a relatively stable constituency with a clear frontrunner.

Alliance Positioning: UDF Leads Across Key Voter Dimensions

The UDF leads across all major perception metrics, creating a consistent and well-balanced advantage.

  • Strong leadership and trust scores reinforce credibility
  • High inclusiveness reflects deeper voter connection
  • Youth appeal advantage indicates broader outreach

The LDF remains competitive but trails across all dimensions.

Key Insight:
Chalakudy reflects a constituency where UDF has built a strong and consistent perception advantage.

Vote Share Trends: UDF Maintains Clear Lead

  • UDF: 51.38%
  • LDF: 38.76%
  • NDA: 9.86%

The UDF crosses the 50% mark, indicating a strong and consolidated voter base.

The LDF trails by over 12 percentage points, while NDA remains marginal.

Key Observation:
Chalakudy is a constituency where perception strength directly translates into electoral dominance for UDF.

The Underlying Story: Stability with Competitive Context

Chalakudy presents a structured electoral pattern:

  • UDF leads in perception
  • UDF leads in vote share
  • LDF remains competitive but behind

This creates a stable yet competitive environment.

Conclusion: UDF Firmly Ahead

Chalakudy stands out as:

  • A strong UDF constituency
  • A seat with clear perception advantage
  • A relatively stable electoral landscape

With consistent strength across all indicators, the UDF remains firmly ahead heading into 2026.

About Semiotica.ai

Semiotica.ai is a global leader in AI-powered electoral intelligence, providing:

  • Voter sentiment analysis
  • Constituency-level insights
  • Alliance positioning intelligence
  • Campaign strategy tools

๐Ÿ‘‰ Follow Semiotica.ai for real-time election intelligence and AI-driven insights into Kerala 2026.